
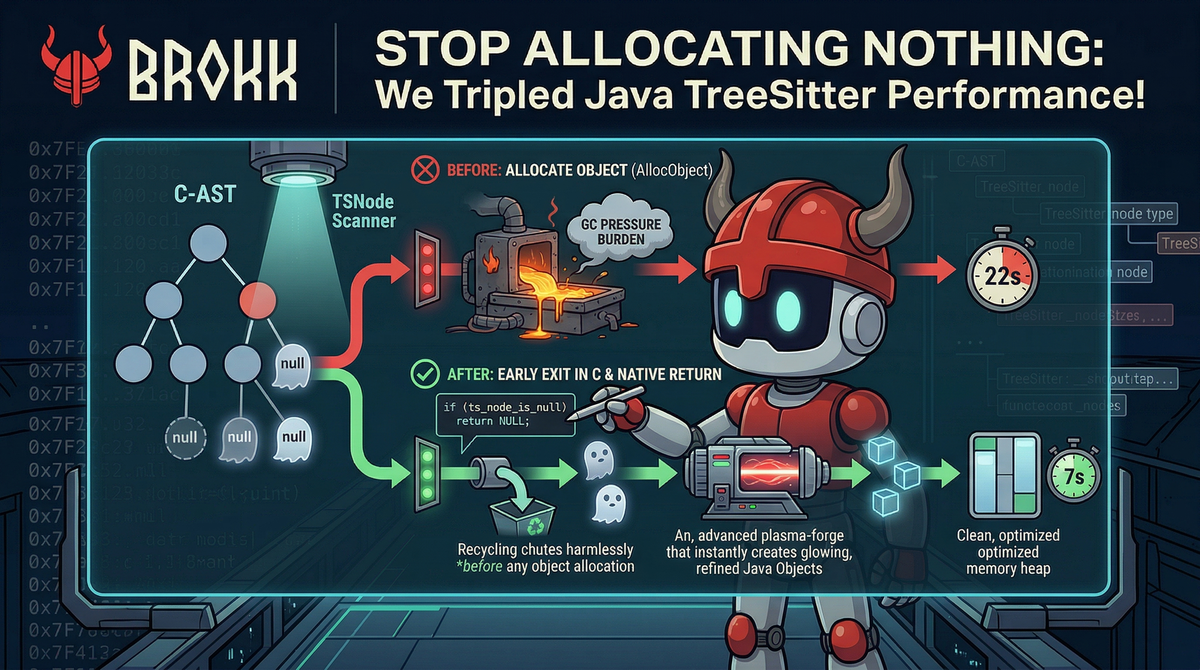
Stop Allocating Nothing: How We Tripled Java TreeSitter Performance...
(...on our CI/CD performance regression tests)
Upgrades in this post are available from version 0.23.4.
Using TreeSitter in a JVM environment is fragmented and often requires manual setup.
The official binding, jtreesitter, requires compiling native C code, which is impractical for many users and often a non-starter. This led to the popularity of the bonede fork (by Wang Liang), which provided pre-compiled binaries and became the de facto standard. At Brokk, we use our own fork of the bonede lineage that adds deterministic cleanup of native structures, JSpecify null annotations, and an on-demand iterator-based approach using node.getChildren(), making the high-level code much cleaner
Recently, while running a performance regression benchmark with a 1,000 max file limit against various open-source repositories on a GitHub CI/CD runner, we noticed our analysis was taking about, on average, 22 seconds.
This was slower than expected. Investigation of the JNI layer revealed unnecessary object allocation for null nodes.
Problem: Null node handling
TreeSitter traversal involves frequent AST navigation. Many nodes have optional children—things like a try block that might or might not have a “finally” clause. When requesting a missing child node, the bonede binding performs unnecessary work in the JNI layer.
Every time a node was requested, the C code would cross the JNI boundary and execute a function called ts_node_to_obj. For each node, including null nodes, the following steps occur:
- Cross the JNI boundary from Java to C.
- Call AllocObject: This tells the JVM to allocate a new
TSNodeobject on the heap. - Call SetIntField and SetLongField six times to populate the object’s internal pointers and metadata.
- Return the object to Java.
- Java-side Check: The Java code would then immediately call
TSNode::isNull, realize the node was empty, and throw it away.
TSNode::isNull also crosses the JNI boundary.
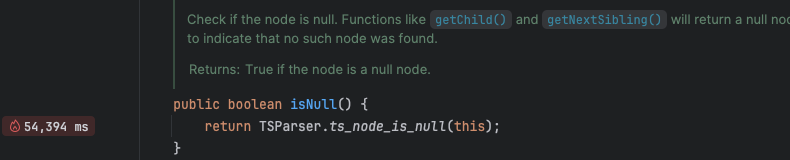
  public boolean isNull(){
    return TSParser.ts_node_is_null(this); // (JNI bound function)
  }
This corresponded to simply calling the following C code.
bool ts_node_is_null(TSNode self) {
return self.id == 0;
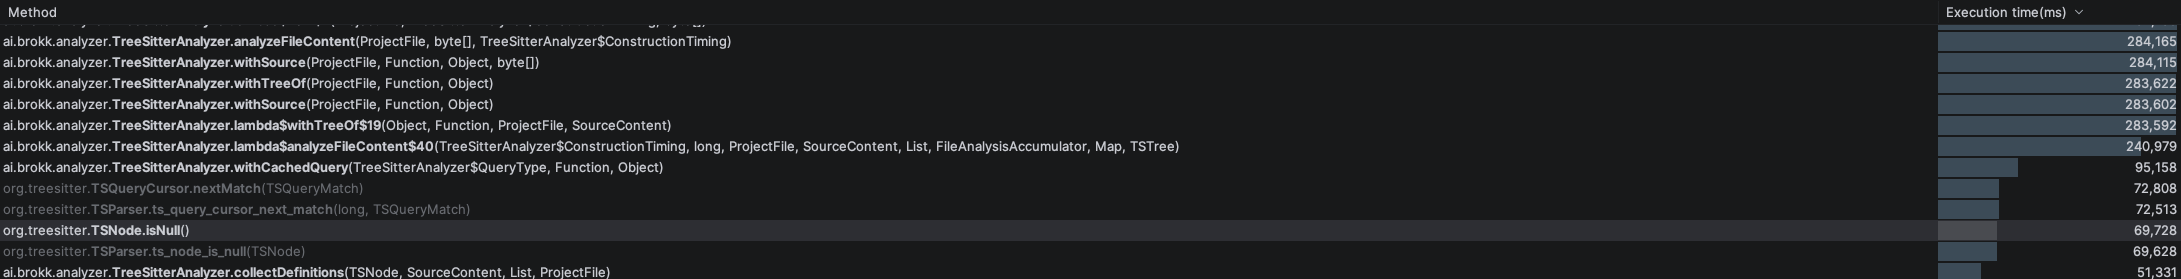
}These nodes should be treated as immutable, so if a node is not null, it won’t become null during its lifetime, even after an incremental edit. To illustrate the impact, here is a screenshot of the IntelliJ profiler showing how “hot” this path is when running the regression tests on my local machine:
TSNode is null during benchmarks across 3 iterations.Across large analyses, this produces millions of short-lived objects, increasing GC pressure and forcing frequent cleanup. This creates massive Garbage Collection (GC) pressure, forcing the JVM to constantly stop and clean up the "nothing" you just created.
The Fix: Early Exit in C
The solution was straightforward. We modified the ts_node_to_obj function in our C layer to check if the node was null before talking to the JVM's object allocator.
The C Change
In our Brokk fork, we added an early return:
// In our JNI layer
jobject ts_node_to_obj(JNIEnv *env, TSNode ts_node) {
  if (ts_node_is_null(ts_node)) {
    return NULL; // Avoid JVM allocation entirely
  }
  // ... otherwise, proceed with AllocObject and field population
}
By returning a native NULL, the JNI layer simply hands a Java null back to the caller. No heap allocation, no field setting, and no GC overhead.
The Java Cleanup
This simplifies the Java-side traversal logic by removing redundant null checks:
// Before: Heavy and redundant
for (int i = 0; i < node.getChildCount(); i++) {
  TSNode child = node.getChild(i);
  if (child != null && !child.isNull()) {
    // do work
  }
}

// After: Idiomatic and fast
for (TSNode child: node.getChildren()) {
  // do work
}
Results
The impact was measurable immediately. We ran our standard performance benchmark, analyzing 1,000 files in a daily regression suite, and the runner completed with an average iteration time of just under 7 seconds.
Initial results appeared anomalous. So we ran the same experiment on a developer laptop, before and after the fix. The JVM was set to use a maximum heap size of 256Mb to introduce some GC pressure. We then focused our profiler's method tree on the main file parsing and indexing entry point, TreeSitterAnalyzer::analyzeFileContent:
Null checks account for ~25% of total CPU time across the three iterations (Figure 2). After the fix, total CPU time drops to ~140 seconds (Figure 3).
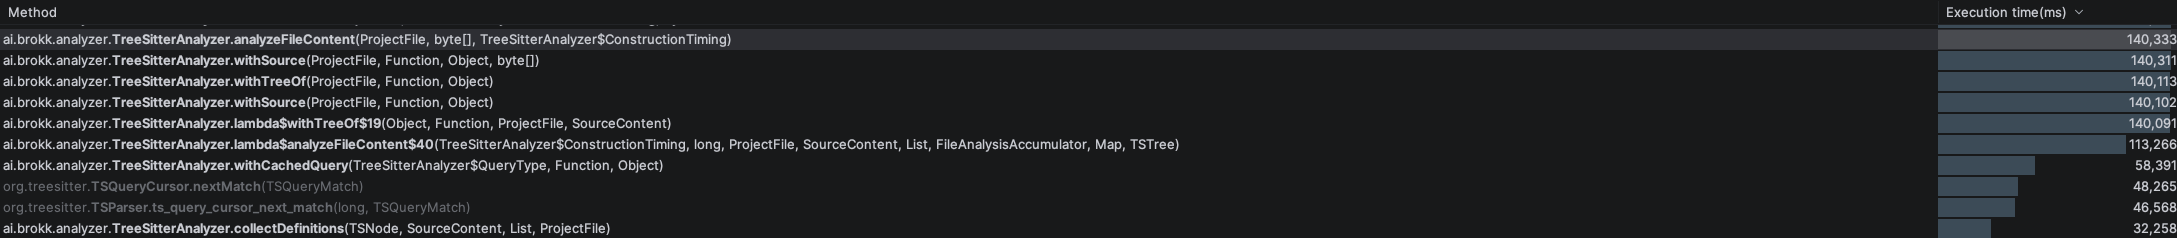
The improvement was approximately 2× locally and ~3× on CI. The parsing and indexing make use of multi-threading, which may close the gap on developer hardware.
The improvement comes from reducing JNI overhead rather than optimizing C execution. Eliminating transient allocations reduces GC overhead and shifts execution toward analysis work.
For our clients, this translates to faster code intelligence, a more responsive UI during codebase exploration, and lower resource consumption on their machines.
In JNI-heavy systems, minimizing boundary crossings is critical for performance.